One of the market manipulation metrics we pay attention to is the time of the trade distribution. Both Huobi and OKEx show abnormal distributions for second-of-the-trade and minute-of-the-trade graphs.

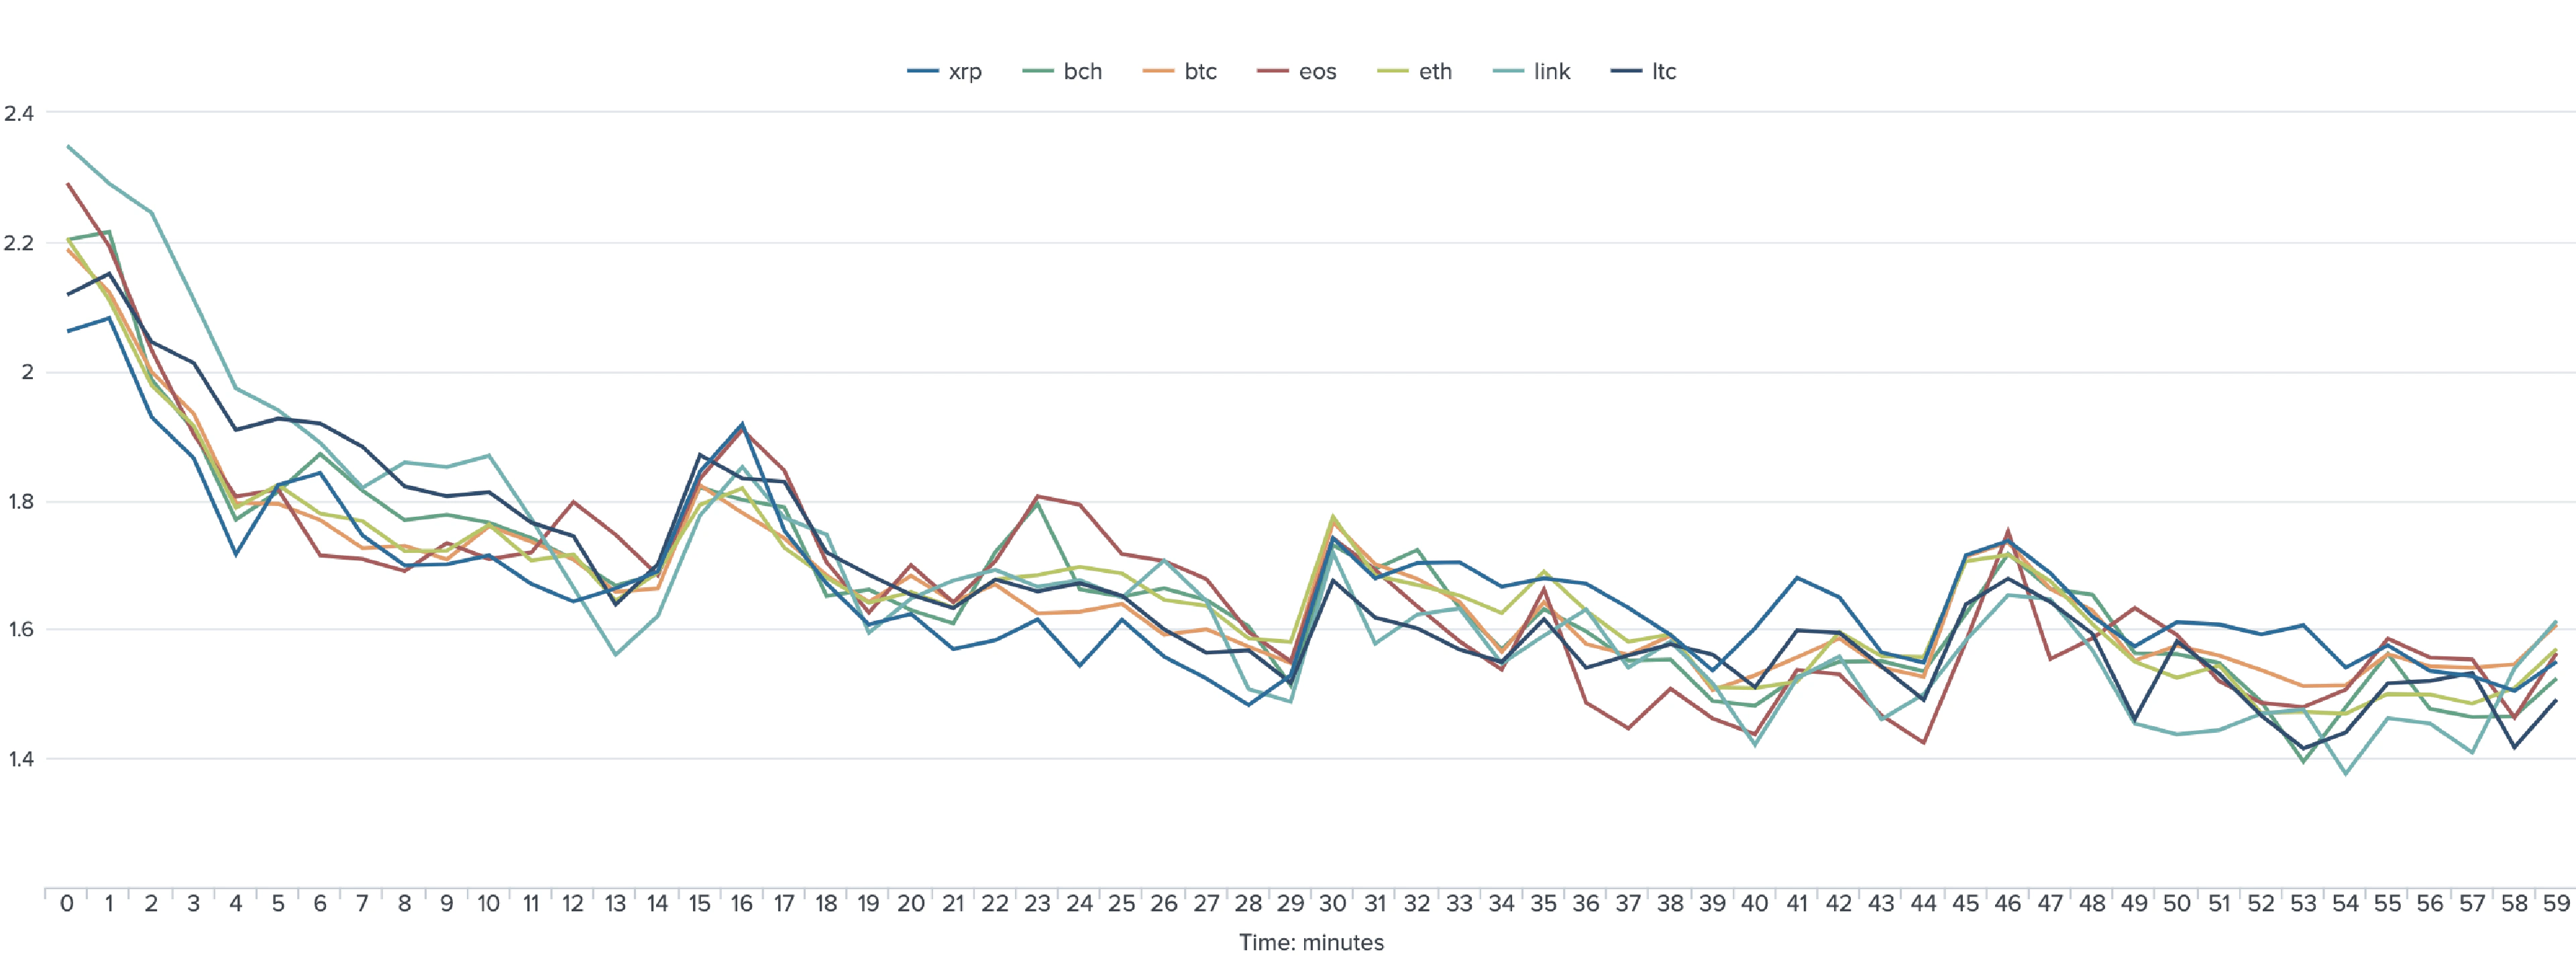
On Huobi, the spot market graph displays the convergence of various assets at the same time periods (15, 30, 45 minutes).
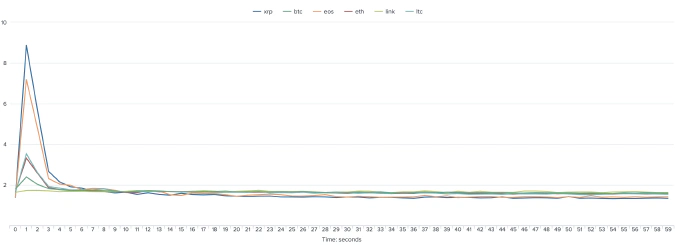
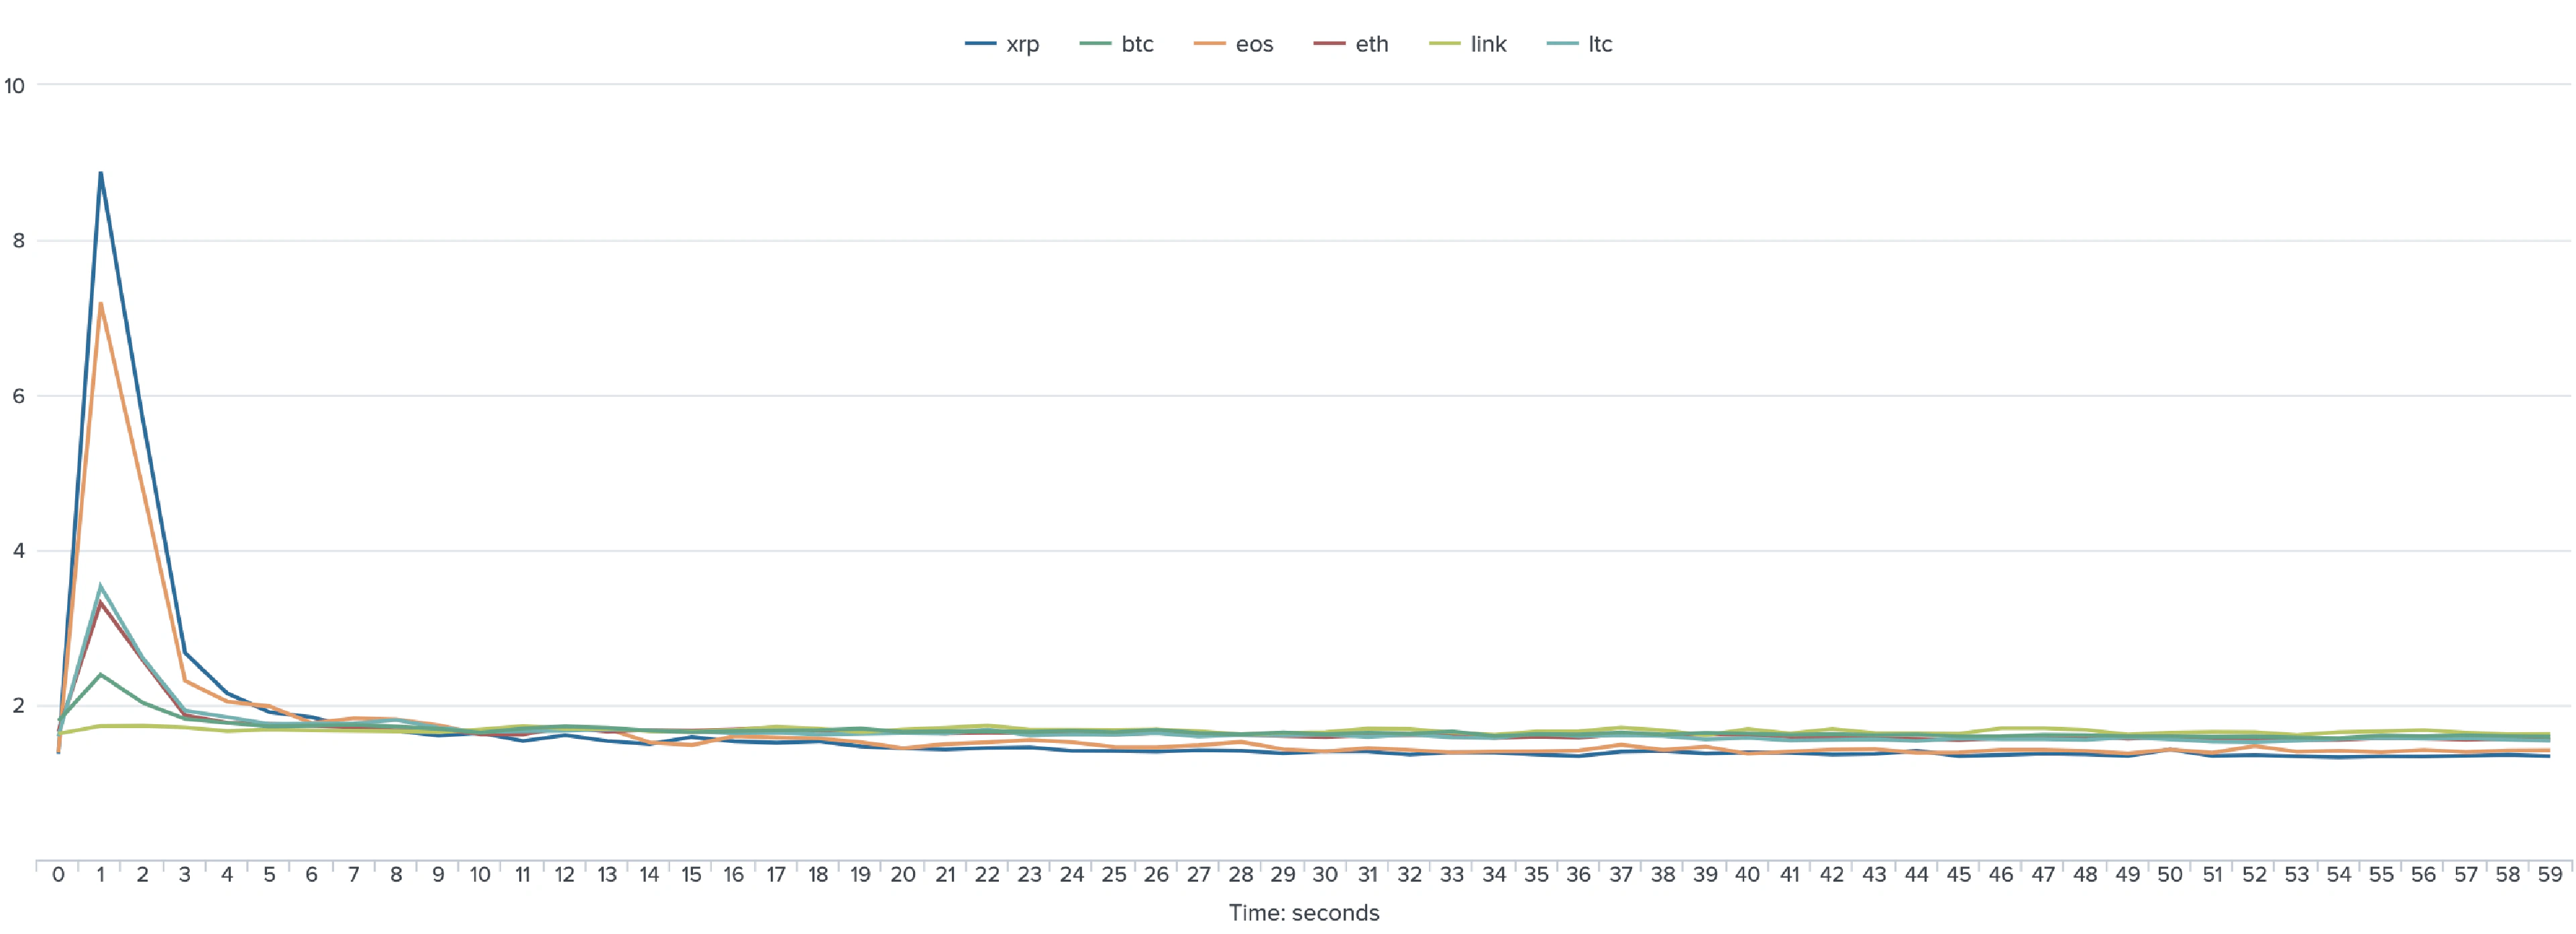
The vast majority of trades on OKEx are executed during the first seconds of the minute (1-4 sec). This distinct surge on the graph can be evidence of the exchange either participating in wash trading or looking the other way to allow a few trading accounts to dominate their order books.