What’s behind an index price?
This short article discusses an automated data-driven trading model for selected cryptocurrencies, with the goal of creating a trading strategy that produces long term positive returns. Fundamentally, the model is based on a mean reversion concept borrowed from traditional finance, which essentially states that an asset price should revert to its long term average. One can expect that, absent shocks or trends, an average long term price should be more or less constant. And therefore occasional movements in price will have to be offset to some degree by opposite price movements in order to maintain the price average.
Even though the change in price level can be expected often in the cryptocurrency market due to the abundance of various shocks and trends , it appears that price movements often follow a pattern of moving too much in the direction of the change and then reversing some of the movement. Which is essentially the same mean reversion principle, but taking into account shifts in the market. To capitalize on such a pattern, the approach is essentially a classification predictive model that attempts to predict a reversal in a coin price that deviated too much from a longer-term moving average price. The results of this predictive model are then supplied into a rule-based trading logic that executes actual trades. In a simulation using Inca Digitals data and analytics tools, trading many cryptocurrencies using this model produces positive returns. Predictive Model
Bitcoin prices will be used for the purposes of describing the model, however the same logic is applicable to other coins.
Any successful trading strategy is a prediction exercise. Since this is an attempt to approach trading in quantitative way, the foundation of the whole process is a predictive model based on statistical techniques.
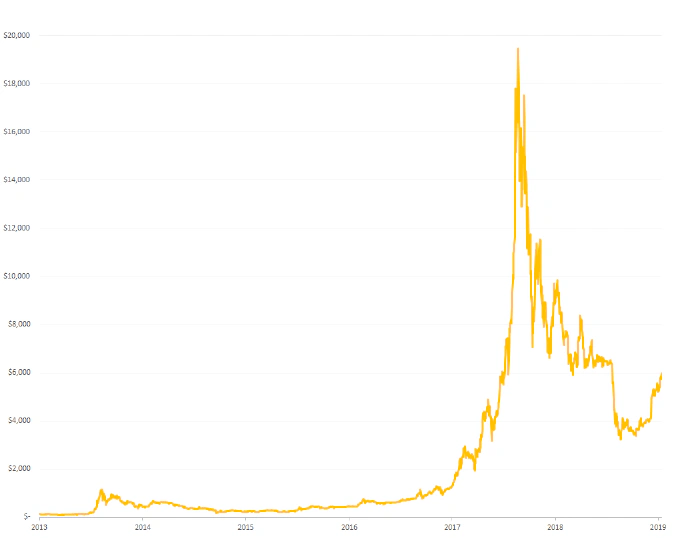
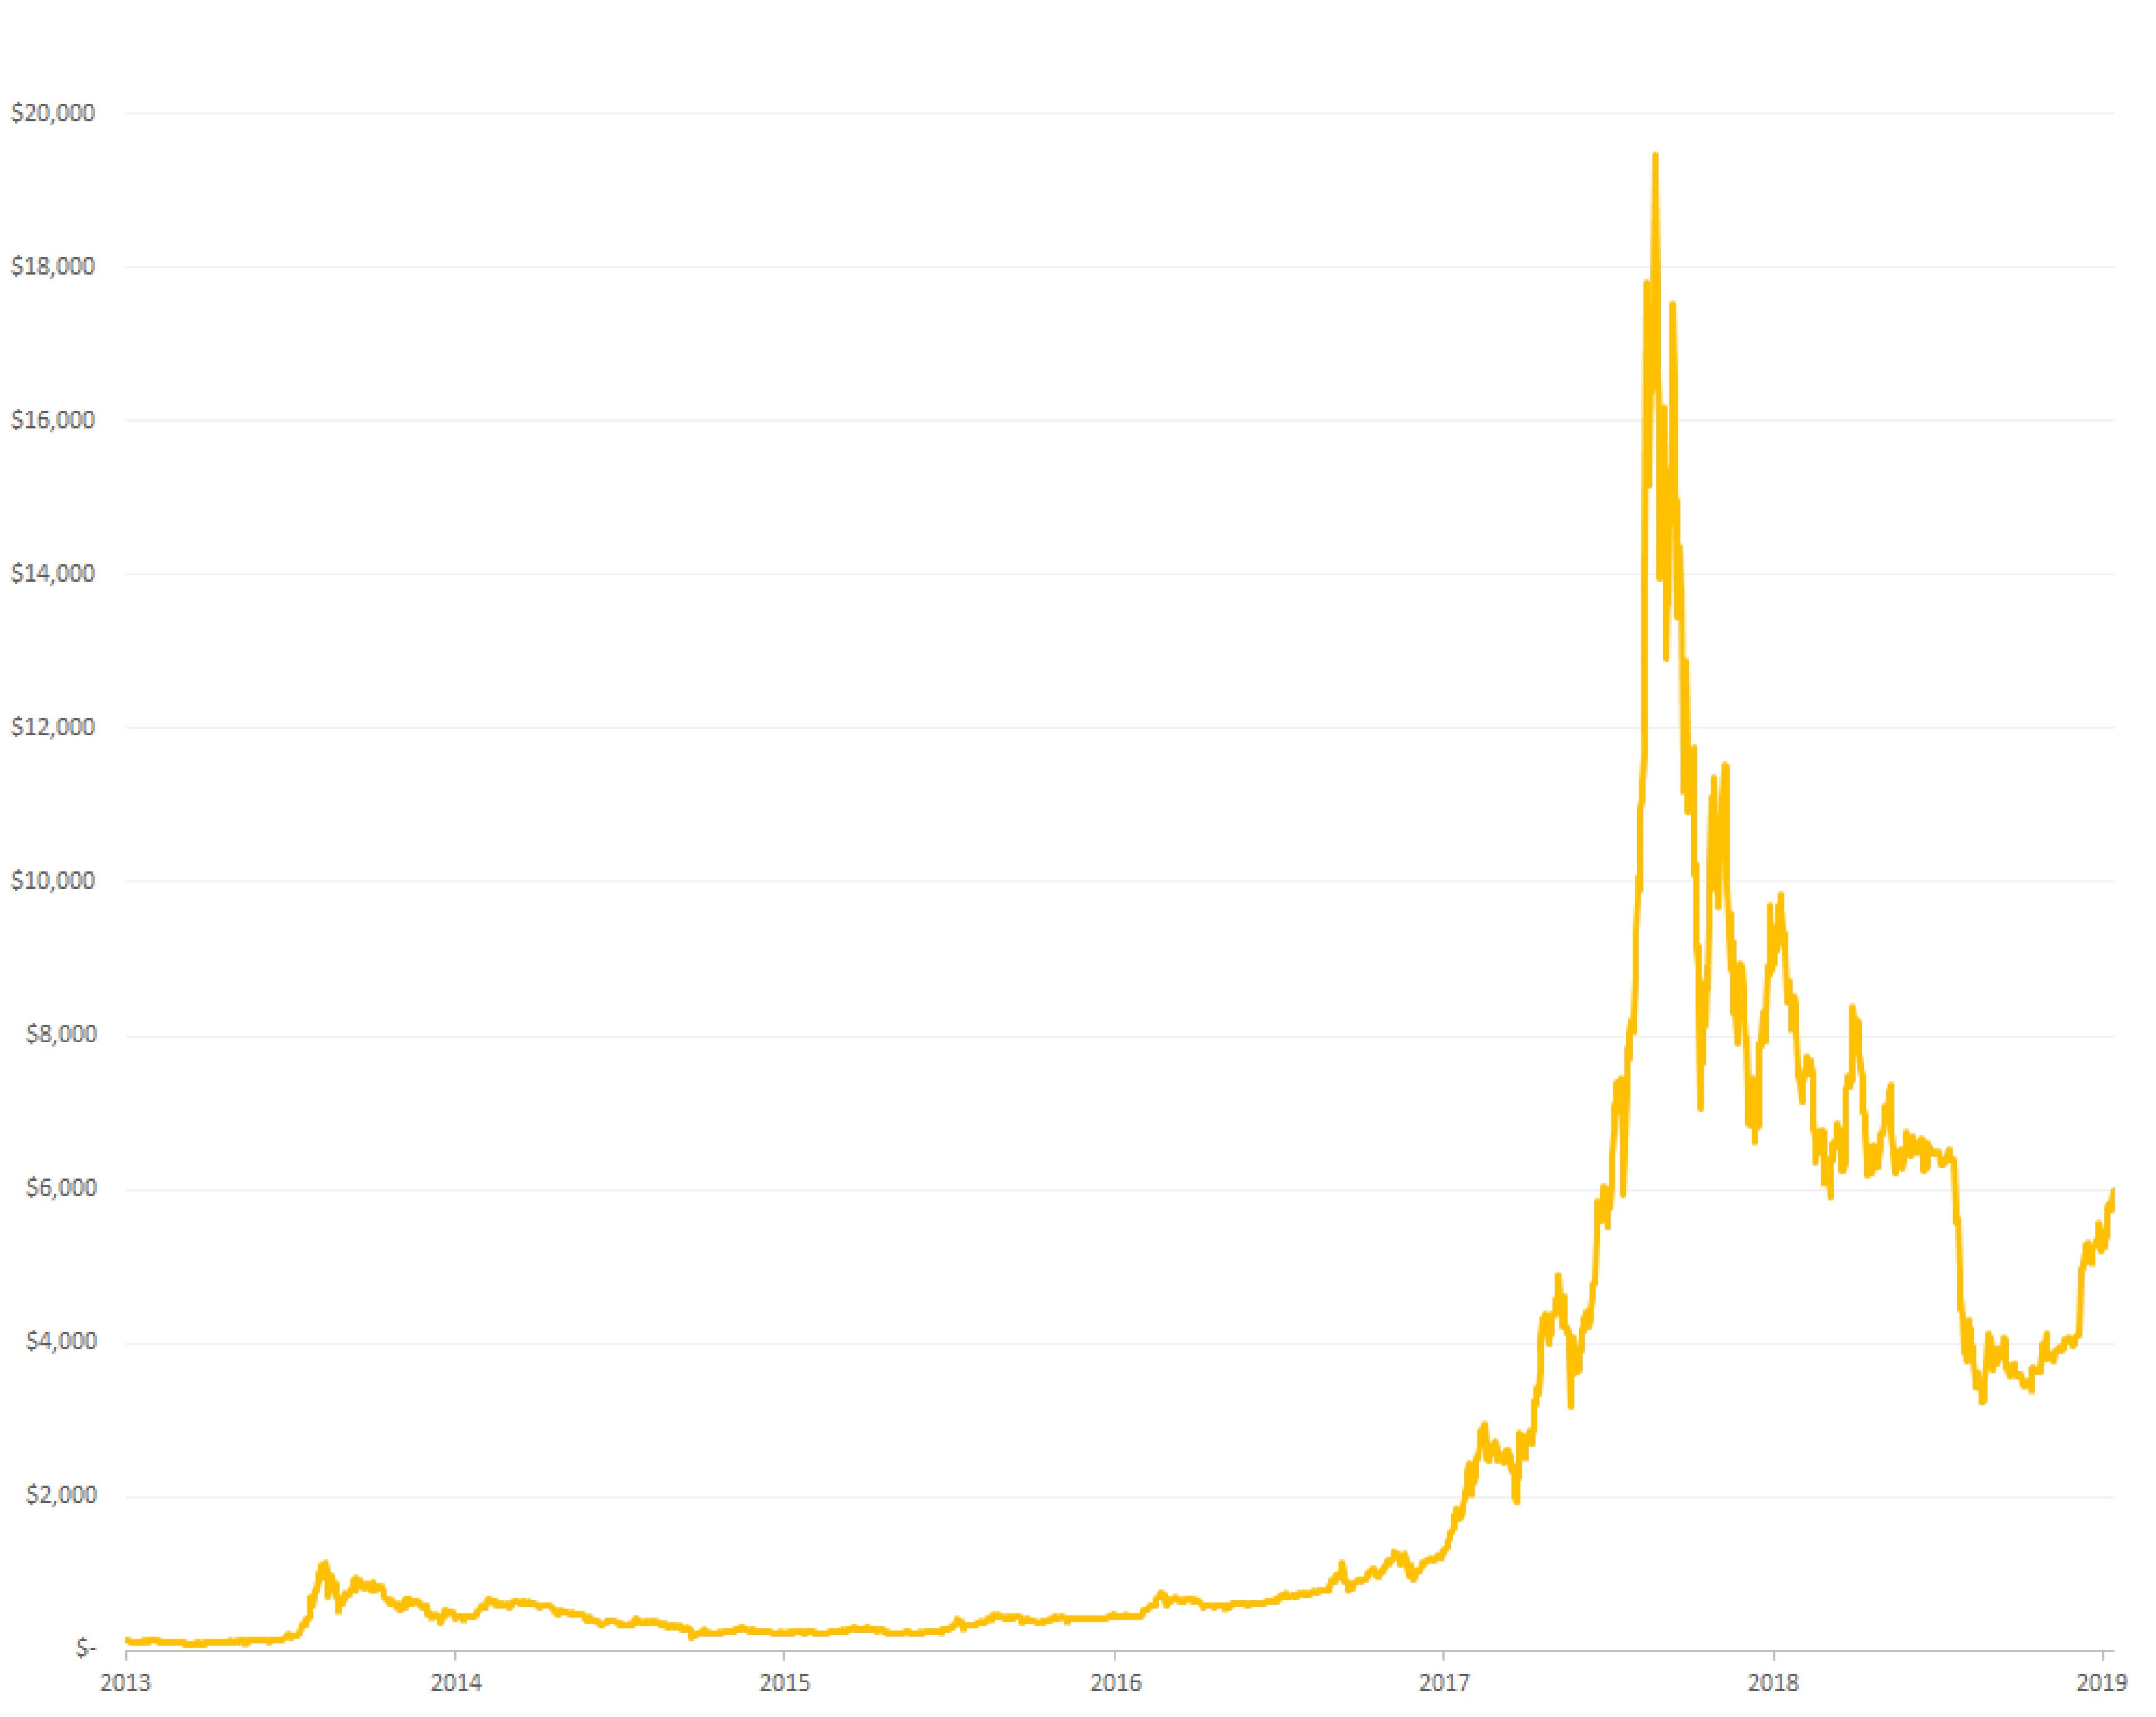
Looking at a bitcoin daily price graph, it is quite impossible to see any meaningful repetitive patterns.
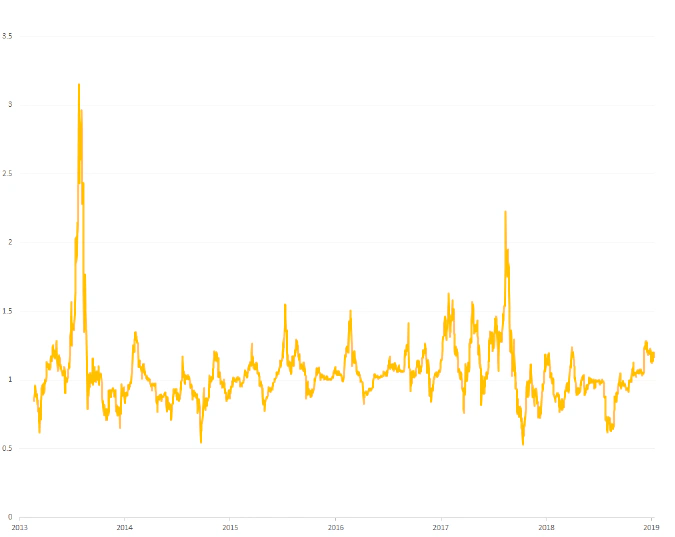
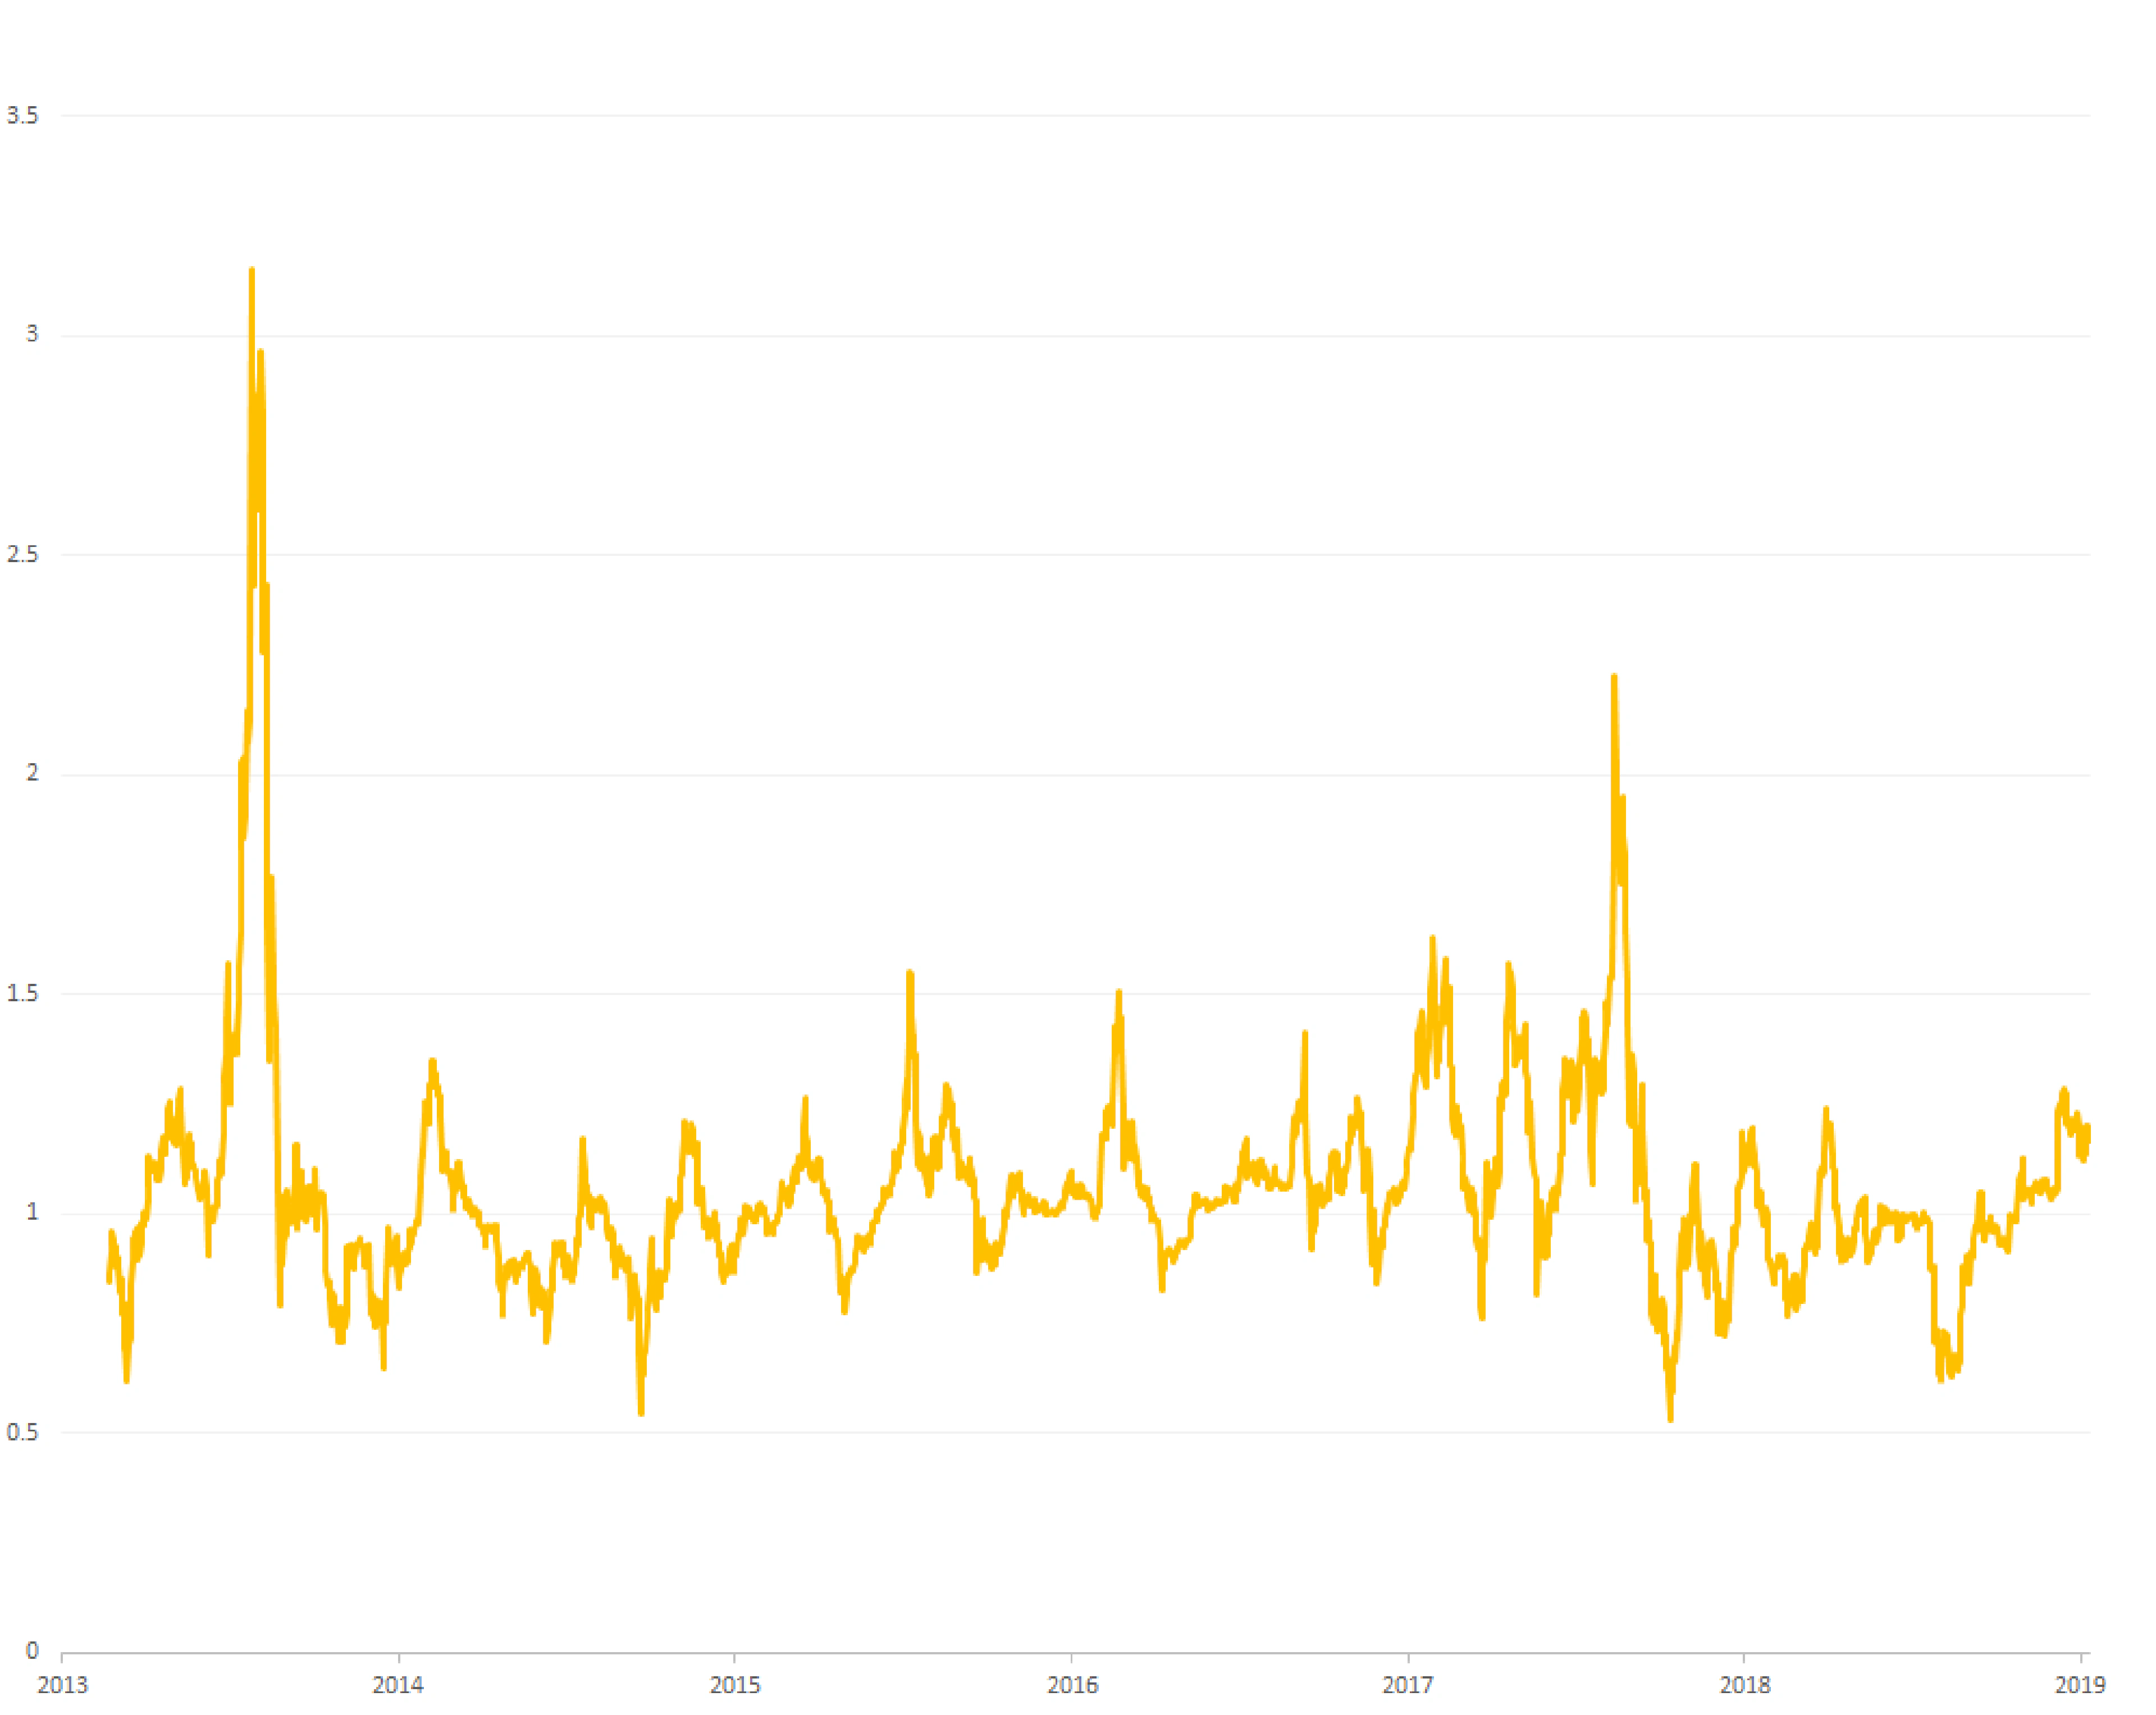
However, a ratio between a price and its moving average behaves much better. There are clear visible cycles. And while there is clearly a lot of noise here, some statistical modelling is possible.
A first approach is to predict this series directly. If possible, simple algebra shows that this would translate into predicting actual price, which is highly desirable. Indeed a statistical autoregressive model with an excellent fit is possible, however simulations proved it to be useless. The reason is that the model fails to predict price reversions, which are pivotal to trading.
In order to avoid this problem, another auto-regression model was developed, which only predicts the direction of this series. Essentially, it exploits the trade-off that by avoiding predicting the actual price, we can build on the quality of predictions in predicting only the direction. Since the goal is now much simpler, the model avoids dealing withmuch noise in the data.
Since the model predicts the direction of the series, there is a trading opportunity once there is a change in direction. Simulations, however, showed that simple rules fail in the long run. Note that in figure 2 above, value above 1 implies a growing price, and a value below 1 implies a decline. Even though the series shows repetitive cycles, the implication for trading is different from cycle to cycle because some of them happen while the market is in overall decline, while others happen while the market is growing. So a second model was developed, which predicts overall market growth vs decline.
The set of rules for the first direction model is now split in two, depending on predictions of the second growth-or-decline model.
The fit for these models is acceptable and indicates that both models pick up signals using Inca’s data solutions.
Trading logic
The directional predictive models produces a number between 0 and 1 as output. A number close to either of these extremes indicates strong signals towards one of the direction. Similarly, the market growth-or-decline model produces a number between 0 and 1 that indicates a signal towards market growth or contraction. Both of them occasionally contain errors, and a number in the middle of the 0 to 1 range represents a weak signal. Therefore, the trading strategy should be different depending on a particular combination of these outputs.
Based on various simulations, it appears that there is a combination of rules that produces positive returns for most coins in the long run. Translated into plain language, the rules imply that if there is a good chance of overall growth predicted by the growth-or-decline model, then we should short the coin only if the direction model produces strong signals for a decline. Similarly, if there is a strong signal for decline, we should long the coin only if there is a strong directional signal for growth. Note that this rule is not symmetrical despite how it sounds — the required confidence to sell during growth is higher than the required confidence to buy during decline. There are also indecisive regions of the outputs, when the signal is too weak either way. In such cases, the rule is to continue to hold existing position.
Trading rules also depend on price levels and sometimes a trade recommended by a signal is not executed if price levels appear to be unfavourable.
Since both predictive models are probabilistic in nature, they should be expected to occasionally produce wrong signals. To guard against these, an extra rule was put in place that requires an accumulation of a particular signal over a fixed number of time periods before a trade is made. Here time period is a the step of the time series data upon which the model is build — i.e. daily, hourly etc.. In simulation, a rather long waiting time between 12 and 18 time periods produced the best result. Also, an alternative approach was developed, when the waiting period is much shorter, but depends on the strength of the signal in the model. There are two variants of this approach different in how favourable/unfavourable price levels are tracked. For some cases, the second approach produced better results. Simulation
For the purposes of developing the trading logic, the two predictive models described above were fit into the daily bitcoin data. Then trading logic was developed and tested on the piece of withheld daily data. Then the same models were fit into hourly data for various coins — these produced different model parameters for each model, but the model structure is the same across all coins and the same as in the daily data models. The trading logic that was developed on daily data was then applied on withheld portion of hourly data. The results are summarized in the table below.
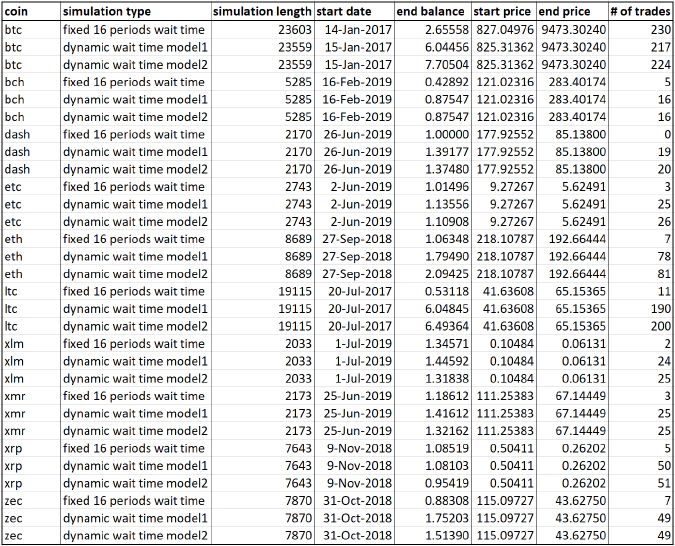
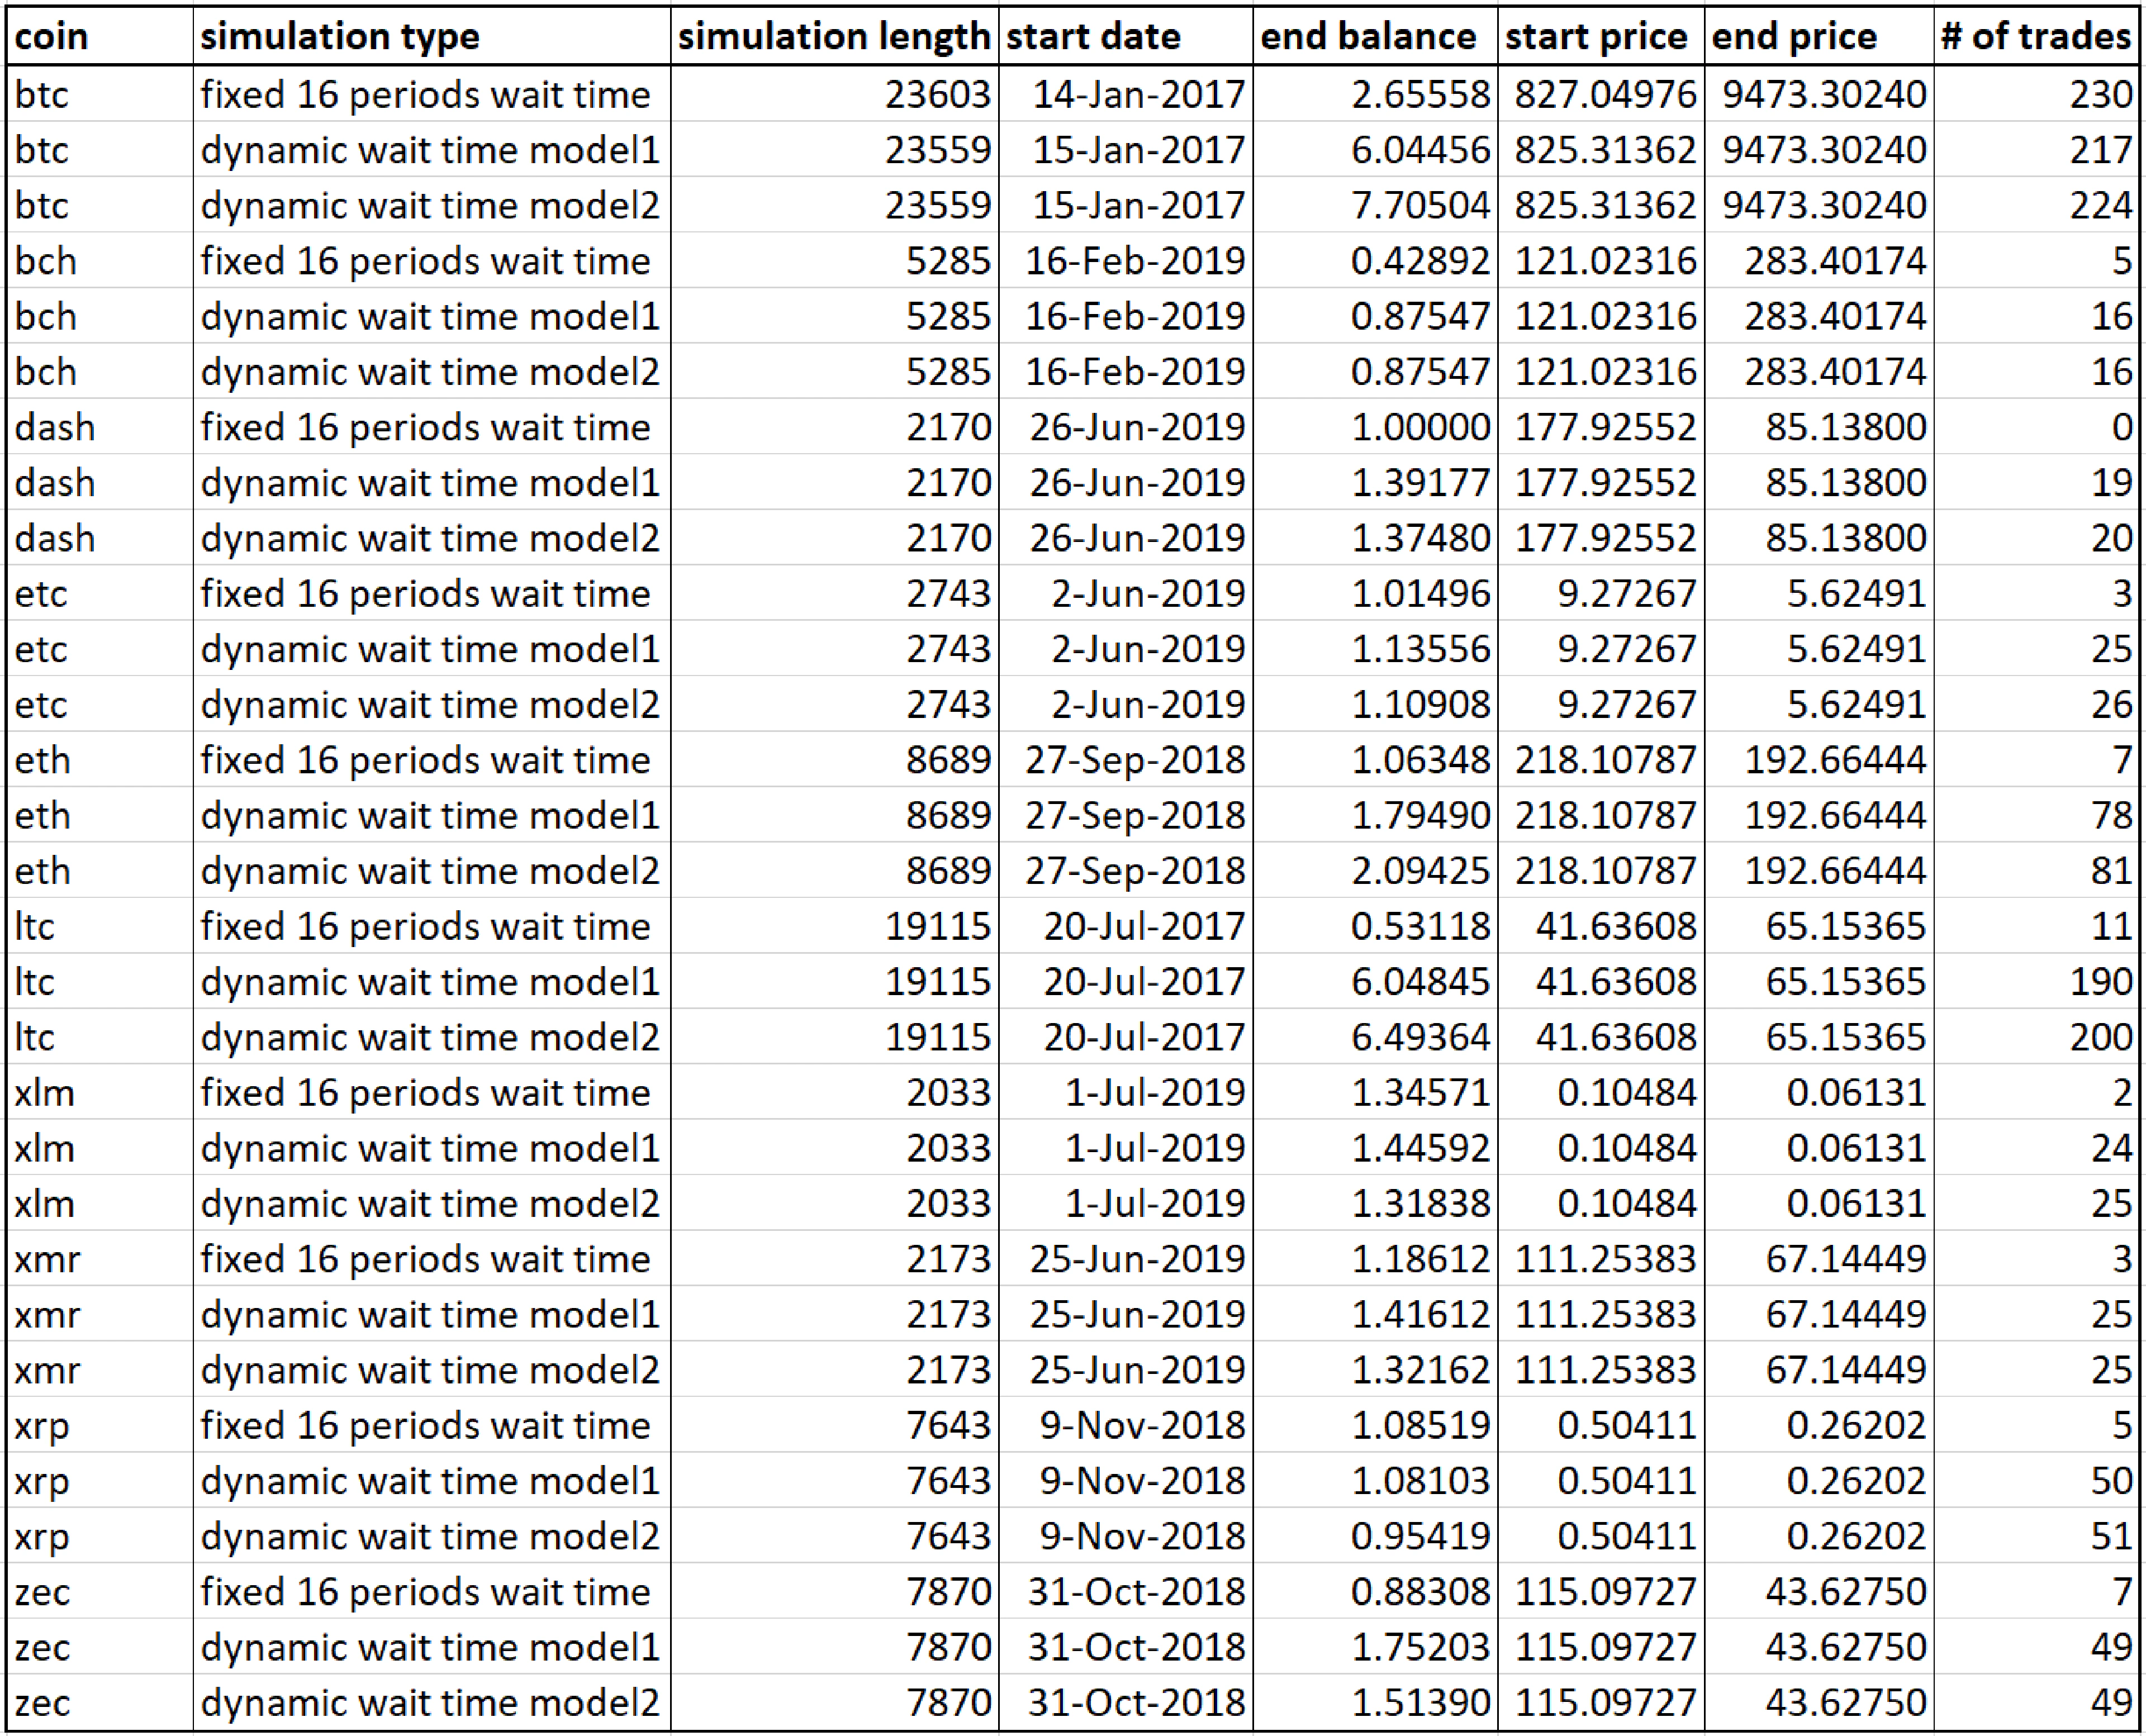
Each simulation starts with long of 1 coin, and the ‘end balance’ field in the table indicates how many coins are there in the end of the simulation. Most of cases are profitable, but it should be noted that even the most profitable models occasionally make mistakes and lose money — but they are able to recover in the subsequent trades.
This model’s trading signals and an many other data streams are available with Inca’s data solutions.